By Backtestle · Last updated:
The first 100 trades: how many trades are enough in a backtest?
Short answer: 20-30 trades tell you almost nothing about a strategy; 100 trades is the first meaningful checkpoint and 200 is a sturdier one. But there is no magic number: if results are volatile (wins and losses vary a lot), you need more trades. For the basics, see how to backtest a trading strategy.
First, the unit: expectancy in R
Measure backtest trades in R, not dollars. 1R is the amount you risk when you enter (the distance to your stop). A trade closed at the stop is -1R; one closed at the target might be +2R. That way trades with different lot and account sizes can be compared.
Expectancy = (win rate × average win in R) − (loss rate × average loss in R)
Example (hypothetical): win rate 40%, average win +2.5R, average loss 1R. Expectancy = 0.4 × 2.5 − 0.6 × 1 = +0.40R. You expect 0.40R per trade on average, but that average is noisy: over 10 trades the result can look very different.
Confidence interval: how reliable is the result?
The 95% confidence interval of the average R is "the range where the true average most likely lies":
average ± t × (standard deviation ÷ √n)
n is the number of trades; t grows when n is small (about 2.05 at n=30, about 1.98 at n=100). The site's strategy scorecard uses the same math: if the lower bound is above zero, the edge counts as demonstrated. In the example above, the standard deviation of trades is about 1.7R (from +2.5R and -1R outcomes; it varies with your data):
| Trades | 95% interval (approx.) | Reading |
|---|---|---|
| 30 | -0.25R to +1.05R | Includes zero: no edge shown yet |
| 50 | -0.09R to +0.89R | Still includes zero |
| 100 | +0.06R to +0.74R | Lower bound above zero: first meaningful evidence |
| 200 | +0.16R to +0.64R | Interval narrows, more reliable |
The same average means "maybe luck" at 30 trades and "most likely real" at 100. With higher volatility (e.g. a 3R standard deviation) the interval widens and 100 trades may not be enough. To narrow the interval to ±0.2R you need roughly n ≈ (1.96 × sd ÷ 0.2)² trades; for an sd of 1.7R that is about 280.
On the site: the strategy scorecard
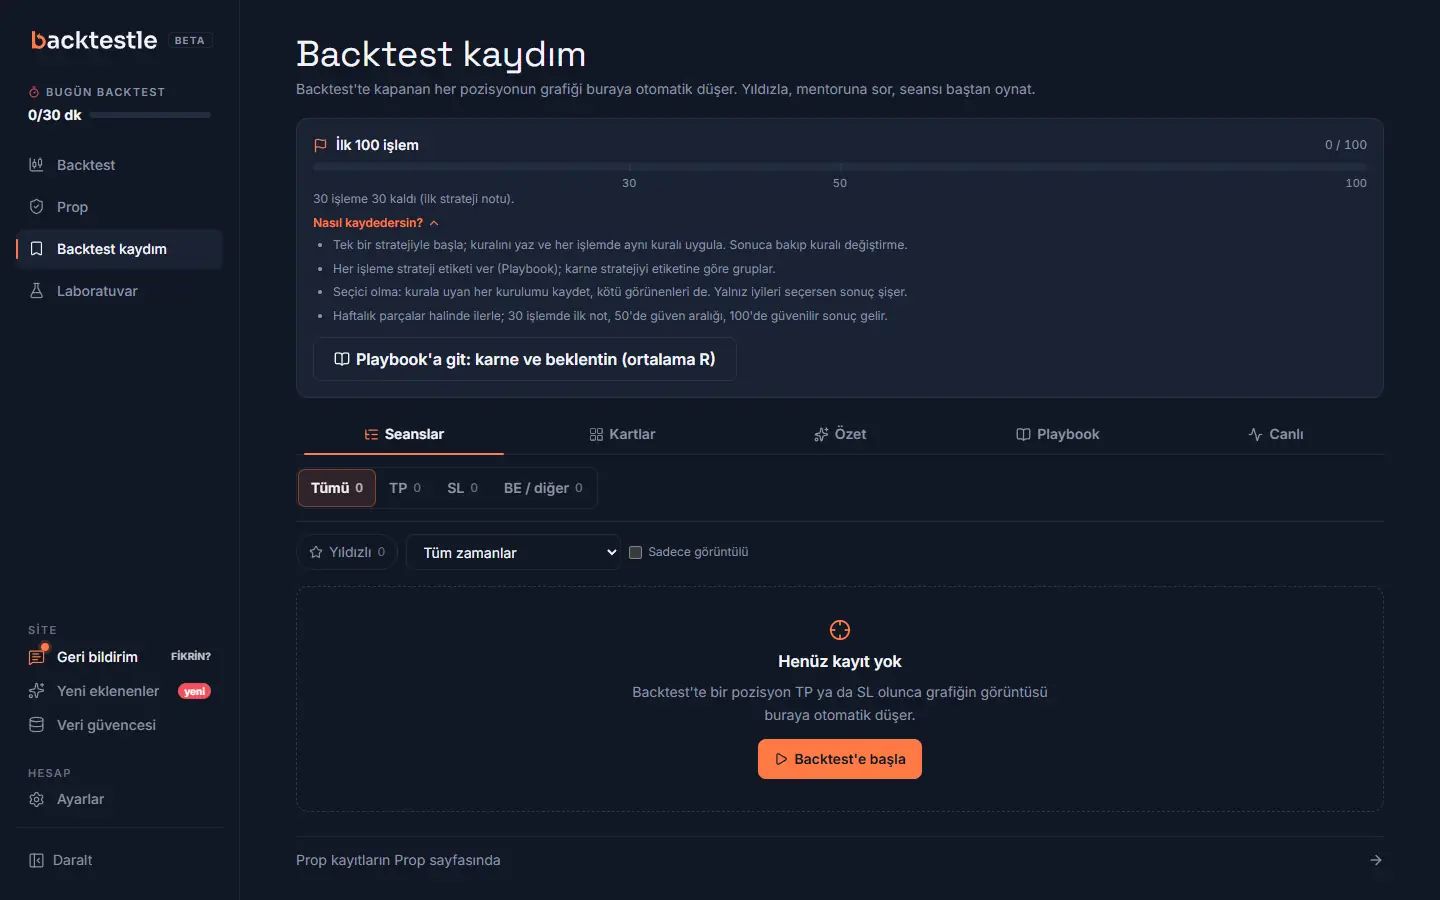
- The scorecard tracks each strategy (the strategy detail in your Playbook) at 30, 50, 100, 200 trade checkpoints. No grade is given before 30 trades.
- The grade comes from the 95% confidence interval of the average R (A-F): lower bound above zero means B or A; a positive average with an interval that includes zero means C; no evidence means D or F.
- At 30 trades a Monte Carlo simulation unlocks: it shuffles your trades, runs 100-trade sequences (assuming 1% risk and a 10% max loss) and shows the chance of hitting the limit. If that chance is high, the grade drops one step.
So on the site, "the first 100 trades" is not a counter but a 30-50-100-200 journey.
A practical plan
- Pick one strategy and one rule set; collect the first 30 trades without changing the rule.
- Don't split results by session, symbol or setup type right away: 30 trades split into 3 buckets leaves 10 per bucket. Look at the total first.
- At trade 50, check the interval: if it includes zero, don't drop the strategy, keep going.
- At trade 100, if the lower bound is above zero it may make sense to move on to a practice challenge; if not, simplify the rule and start over (tuning the rule again and again on the same data makes the interval look artificially good).
- At trade 200, test again on a different period (other years): does the average hold up there too?
On a prop account the same streak can also hit the daily and max loss limits: see how to pass a prop firm challenge.
Frequently asked questions
How many trades are enough in a backtest?
A meaningful grade starts at 30 trades, 100 trades give the first reliable evidence and 200 trades are more solid. The number you need depends on volatility: if results swing a lot, 100 trades may not be enough.
How do you calculate expectancy in R?
Win rate × average win in R minus loss rate × average loss in R. With a 40% win rate, a +2.5R average win and a 1R loss, expectancy is +0.40R.
What does it mean if the 95% confidence interval includes zero?
With the data you have, you cannot say the strategy really has an edge; the result may be luck. Collect more trades or simplify the strategy. If the lower bound is above zero, the edge counts as demonstrated.
Collect your first 100 trades for free
Trade on the replay chart; trades are logged in R and the scorecard starts grading at 30 trades.
Terms in this guide
See the glossary for a short definition and a worked example.
- R (R multiple)
- Risk-to-reward ratio (stop loss and take profit)
- Expectancy and win rate
- Backtest
- Forward test
- Monte Carlo simulation
- Overfitting
- Confidence interval and sample size
More guides
- How to backtest a trading strategya step-by-step manual backtesting guide
- How to pass a prop firm challengerisk plan and rule management
- 7 steps before a prop firm challengea prep checklist before you pay for a challenge
- Consistency rule (best day %)best day calculator, worked example and firm table
- How is the daily loss limit calculated?base (starting balance / day's opening balance), reset time, floating loss; firm table
- What are swap and spread?triple swap day, TRY pairs, swap-free, news spread, weekend gaps
- Prohibited strategies at prop firmsHFT, latency arbitrage, cross-account hedging, copy trading, trade splitting; firm table
- What is a prop firm and how does it work?challenge, funded account, profit split, rules, risks; firm and program counts from code
- What is trailing drawdown?static, trailing, end-of-day trailing and locked floors; $100,000 example; program table
- Prop firms from Turkeywhich firms have a Turkey note, USD / EUR fees, payouts and identity verification
- All guidesindex and reading order
- Prop firm comparison tablerules of 33 firms
- Backtesting software compareda sourced, dated comparison with FX Replay, Forex Tester, TradingView, BacktestingMax and TradeZella
- Prop rule changelogdated, sourced rule changes and points we could not verify
- Prop firm and backtesting glossarytrailing drawdown, daily loss, R, pip, spread and more
- FAQpricing, symbols, data source and the prop simulator
Sources (last checked: October 13, 2026)
Last checked: October 13, 2026. Firms can change their rules; check the firm's current page before you buy. This content is for education and practice only, not investment advice; past results do not guarantee future returns.