
By Backtestle · Last updated:
How to backtest a trading strategy: a step-by-step guide
To backtest, you write your strategy as clear rules, replay historical charts candle by candle with the future hidden, take a trade with a stop and a target at every setup that fits your rules, and measure the result of at least 50-100 trades in R. No coding needed: first a 4-step shortcut, then the detailed 7-step method; both work the same for forex, gold, indices and crypto.
Backtesting without code: 4 steps
Manual backtesting needs no code; you replay the chart and make every decision yourself. Four steps in the browser are enough:
1. Pick a symbol and a date
On the replay screen, pick the symbol you want to test (EURUSD, XAUUSD, NAS100...) and a start date. To avoid testing only one trend, try dates from different years and market conditions.
2. Hide the future and play
The chart stops at the moment you chose and the right side is hidden. ▶ plays the candles, Space or → steps one candle at a time. Decide on the candle where the setup forms; never enter by looking back.
3. Place the order, stop and target
In the order panel set the direction, entry, stop and target; keep the risk at the same percentage on every trade (e.g. 1%). That way the stop is -1R, a 2R target is +2R, and results stay comparable.
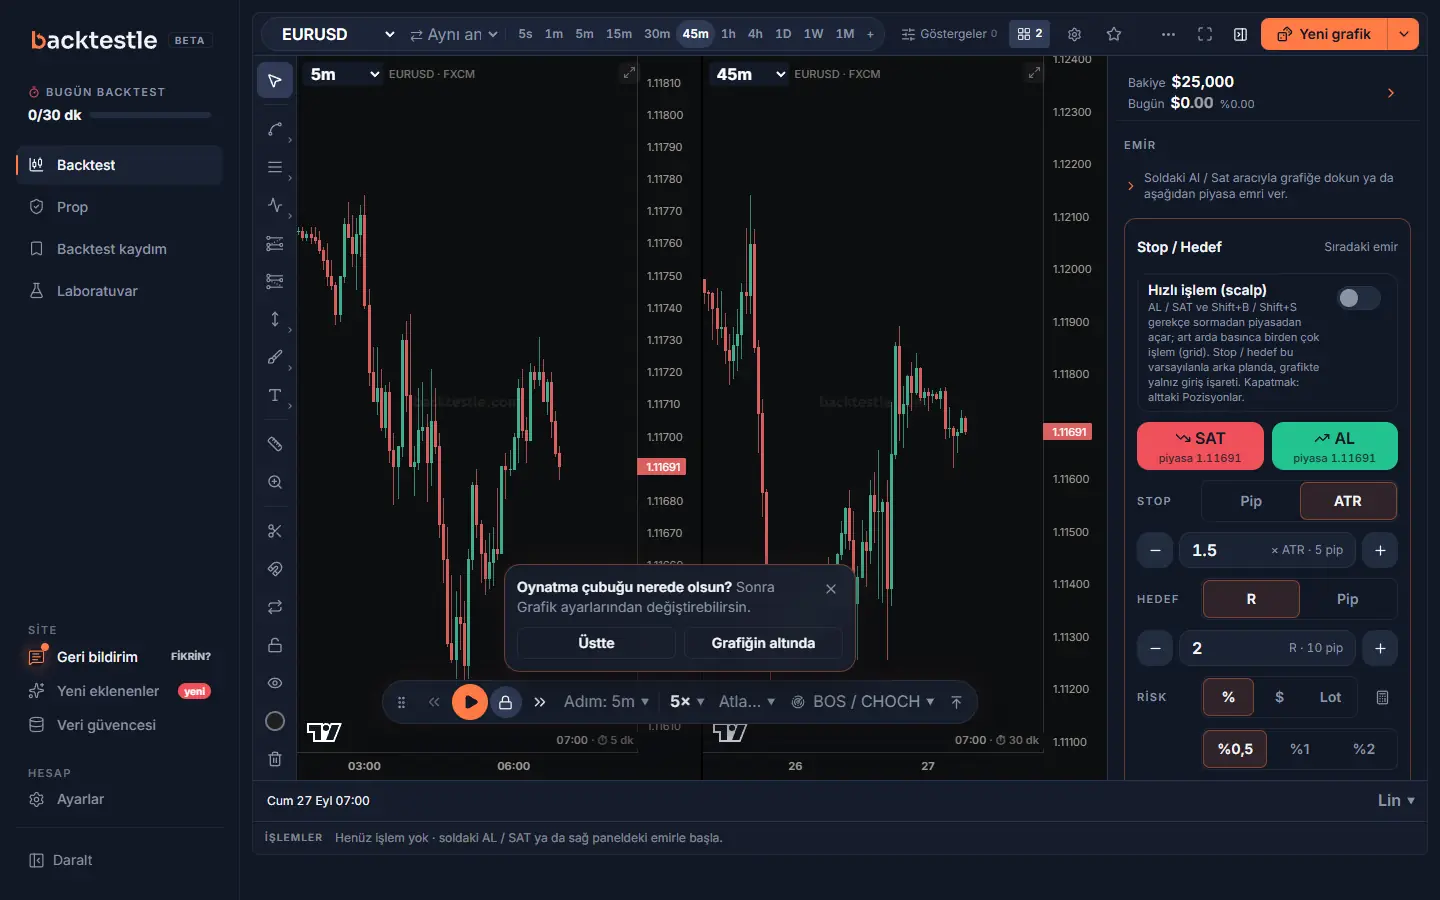
Backtestle replay screen: two-timeframe EURUSD chart, drawing tools, playback bar and order panel with stop / target / risk settings (demo data) 4. Save and check the stats
Every closed trade is written to your backtest log in R and $ automatically; add a short note. After 50-100 trades, check the win rate, expectancy, longest losing streak and maximum drawdown.
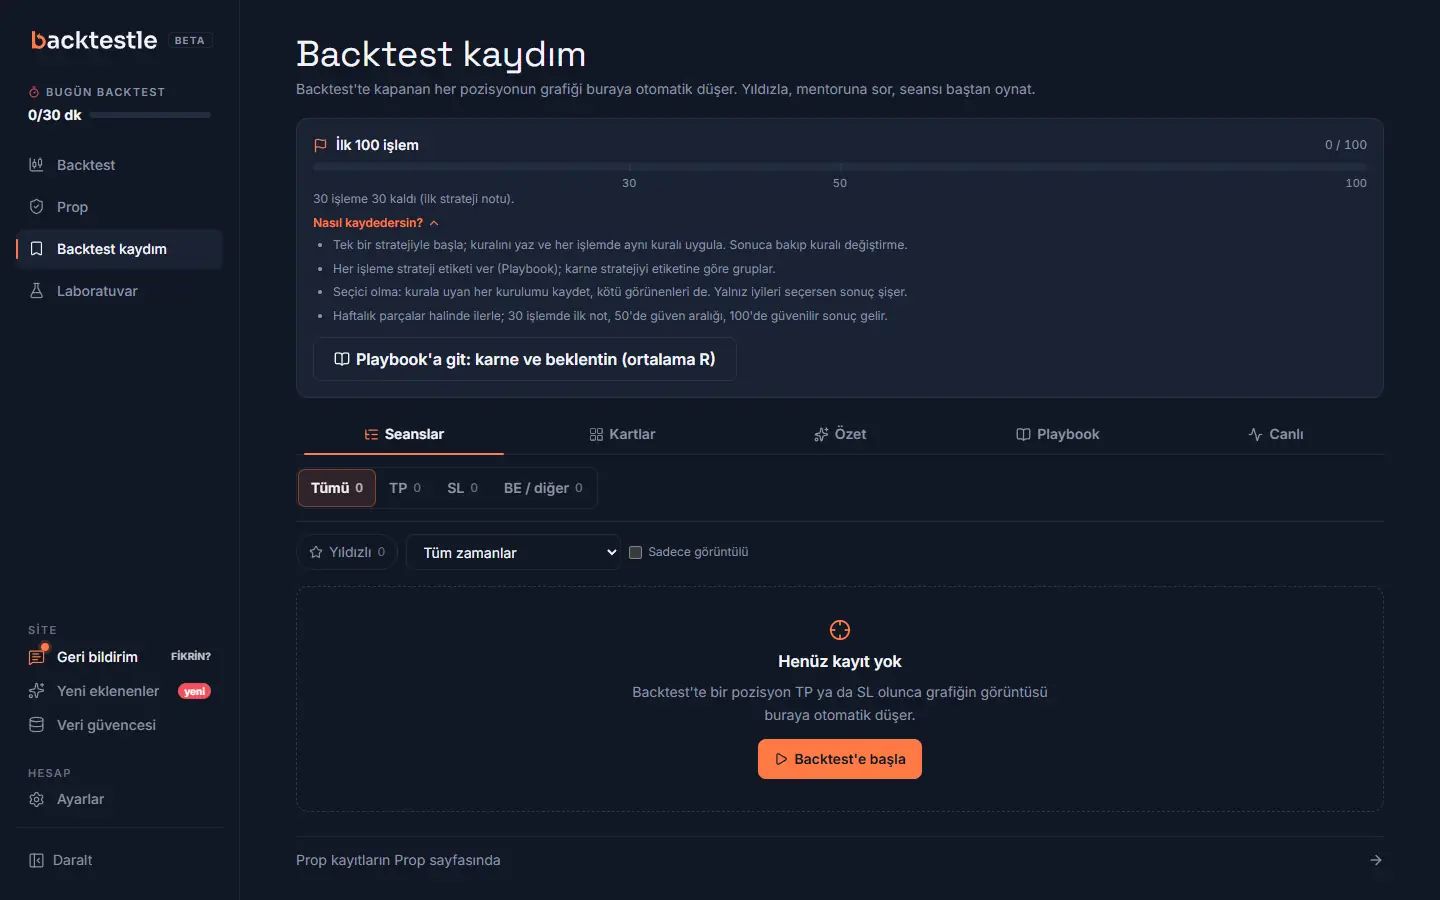
Backtestle backtest journal screen: first 100 trades goal, logging tips and sessions, cards, summary, Playbook tabs (demo data)
Play this moment: a real NFP release
What is backtesting and why do it manually?
Backtesting means applying a strategy's rules to historical price data and measuring the result. The goal is to see whether the rules have an edge before real money is at risk.
Automated backtesting runs on code and scans thousands of trades in seconds. Manual backtesting replays the chart candle by candle, and you make every decision.
The manual method is slower, but it does two jobs. You test without writing code, and you train your eye to spot the setup. For price action strategies, the second benefit is often worth more.
1. Turn your strategy into rules
Write entry, stop, target and trading hours so they leave no room for interpretation. Example: 'On the 15-minute chart during the London session, go long after a candle dips below the previous day's low and closes back above it; stop below the wick, target 2R.' If the rule is vague, the backtest result is not reliable either.
2. Pick a symbol, timeframe and date range
Test on the symbol you will trade live (EURUSD, XAUUSD, NAS100...). To avoid fitting a single trend, pick dates from different years and market conditions (trending, ranging, high volatility).
3. Replay the chart candle by candle
Keep the right side of the chart hidden and reveal candles one at a time. Decide when the setup appears; trading with knowledge of the future (hindsight bias) is the most common backtesting mistake.
4. Open every trade with the same risk and log it
Keep risk fixed on every trade (e.g. 1% of the account) and record the result in R: stop = -1R, a 2R target = +2R. Subtract spread and commission as costs. A screenshot and a short note make mistakes easier to find later.
5. Collect at least 50-100 trades
10-20 trades are mostly luck. Decide after at least 50, ideally 100 trades. If the setup is rare, extend the test period.
6. Measure the results
Look at win rate, average win / loss (R), expectancy (win rate × average win − loss rate × average loss), the longest losing streak and max drawdown. If expectancy is positive and the worst streak is one you can live with, the strategy moves to the next stage.
7. Test again with prop firm rules
Even a profitable strategy can fail a challenge because of the daily loss limit or trailing drawdown. Run the same strategy in the simulator with your target firm's rules (e.g. FTMO 2-step) and see which rule stops you.
50, 100 or 200? To work out how many trades are enough with a confidence interval, see how many trades are enough in a backtest?
What does a sample trade journal look like?
The table below is a sample backtest journal with 10 trades. There is one strategy: a break of structure entry after a liquidity sweep in the London session. Each row records the result in R. The note column makes mistakes easier to find later.
| # | Day | Symbol | Side | Result | Total | Note |
|---|---|---|---|---|---|---|
| 1 | 1 | EURUSD | Long | +2.0R | +2.0R | Followed the rules exactly, 2R target. |
| 2 | 1 | EURUSD | Short | -1.0R | +1.0R | Entry 10 min before news; add news times to the plan. |
| 3 | 2 | EURUSD | Long | -1.0R | 0.0R | Stop sat in the body, not below the wick. |
| 4 | 2 | EURUSD | Short | +2.0R | +2.0R | Clean setup, 2R target. |
| 5 | 3 | EURUSD | Long | -1.0R | +1.0R | Counter-trend entry; check whether it broke the rules. |
| 6 | 3 | EURUSD | Long | -1.0R | 0.0R | Second loss in a row; risk stayed the same. |
| 7 | 4 | EURUSD | Short | +2.0R | +2.0R | Followed the rules exactly, 2R target. |
| 8 | 4 | EURUSD | Long | 0.0R | +2.0R | Stop moved to breakeven at 1R, result 0. |
| 9 | 5 | EURUSD | Short | +2.0R | +4.0R | Asian session high swept, 2R target. |
| 10 | 5 | EURUSD | Long | -1.0R | +3.0R | Entry near the session close, weak move. |
Summary of these 10 trades: 4 wins, 5 losses, win rate 40%. Average win +2.0R, average loss -1.0R. Expectancy is 0.3R per trade. Longest losing streak 2 trades, largest drawdown 2.0R. Ten trades are too few for a decision; the table only shows the format of the log.
How would these trades look in a prop challenge?
Split the same 10 trades over five days and play them under a prop firm program's rules. The firm rules are read from the site's rule table. The result shows how close the strategy gets to the limits.
Sample program FTMO · 2-Step, account $100,000. Target 10%, daily loss 5%, maximum loss 10%, at least 4 trading days. Risk per trade 1% (1R).
| Day | Trades | Day result | End-of-day balance | Left to daily limit | Left to max loss | Left to target |
|---|---|---|---|---|---|---|
| 1 | +2R · -1R | +1% | $101,000 | 5% | 10% | 9% |
| 2 | -1R · +2R | +1% | $102,000 | 4% | 10% | 8% |
| 3 | -1R · -1R | -2% | $100,000 | 3% | 10% | 10% |
| 4 | +2R · 0R | +2% | $102,000 | 5% | 10% | 8% |
| 5 | +2R · -1R | +1% | $103,000 | 5% | 12% | 7% |
After five days the balance was $103,000. No rule was broken; the daily limit came closest on day 3 (3% left). The target is still 7% away. At this expectancy, about 24 more trades are needed. So the strategy respects the rules but moves slowly toward the target. That is useful to know before you pay for a challenge.
Which statistics should you check in a backtest?
- Win rate: winning trades divided by all trades. On its own it means little; read it with the R multiple.
- Average win and loss (R): a 35% win rate can be profitable with a 3R average win.
- Expectancy: the average R per trade. Above zero, the rules tend to make money over time.
- Longest losing streak: how many losses came in a row. On a prop account, this number breaks the daily limit.
- Maximum drawdown: the deepest fall from a peak. Compare it with the overall loss limit.
- Profit factor: gross profit ÷ gross loss. Below 1 means the rules lose money.
When is a backtest result misleading?
- Overfitting: if you fine-tune rules to past data, the edge disappears on new data. Keep the rules simple.
- Look-ahead bias: deciding before the candle closes, or seeing the chart on the right, inflates results.
- One period only: a strategy tested only in a trending year may fail in a range. Pick different years.
- No costs: spread, commission and slippage can push expectancy to zero on small targets.
- Too few trades: a 20-trade result is easily explained by luck.
What are the most common backtesting mistakes?
- Trading with knowledge of the future (looking back at a static chart instead of using replay).
- Changing the rule mid-test; every change means a new test.
- Testing only winning days or calling losing trades 'not counted'.
- Ignoring spread, commission and slippage around news.
- Deciding on too few trades.
- Fixed risk in the backtest, emotional lot sizes live: apply the same risk rule live too.
How do you calculate expectancy and drawdown?
100 trades: 40 wins, 60 losses; wins average +2R, losses -1R. Expectancy = 0.40 × 2 − 0.60 × 1 = +0.2R. So someone risking 1% of the account per trade would make about 20% over 100 trades (before costs). If the same test also shows a 10-trade losing streak, 1% risk means roughly a 10% drawdown: on a prop account with a 5% daily / 10% overall limit, that streak could end the account.
How to backtest for free
There are three free routes: TradingView's Bar Replay, MetaTrader's strategy tester and browser-based replay sites. On TradingView's free Basic plan, Bar Replay works only on daily and higher timeframes; MetaTrader's tester is for coded robots (EAs), not manual trading.
Backtestle is free during beta: replay 189 symbols with available historical data down to minute candles, and trades are logged automatically in R and $. The steps are the same as above: pick a symbol and date, write your rule, collect at least 50-100 trades, read the stats.
We compared the free plans with sources: best free backtesting software.
How to backtest forex
In forex backtesting, session and costs drive the result most. The same setup can work at the London open and fail in the Asian session; split the test by session and read each session's expectancy separately.
Spread and swap distort tight-stop strategies. Spreads are low on majors and wider on crosses and around the rollover hour. Each symbol's typical spread, pip value and daily close time are on its own page.
Backtest by symbol
Symbol pages with data range, pip, typical spread and session:
- EURUSD backtest
- Gold backtest
- Bitcoin backtest
- Nasdaq 100 backtest
- GBPUSD backtest
- Dow Jones backtest
- USDJPY backtest
- Ethereum backtest
- All symbols
How do you move from backtest to live trading?
If the backtest is positive, do not jump to large size. First run the same rules as a forward test on demo or with small risk.
Compare live results with the backtest journal. If win rate and average R stay in a similar band, the rules work live too.
If the gap is large, the cause is usually execution, not the rules. Mark off-plan trades separately in your notes.
Frequently asked questions
What is backtesting?
Backtesting applies a strategy's rules to historical price data and measures the result (win rate, expectancy, max drawdown). In manual backtesting the chart is replayed candle by candle and the trader makes each decision.
Is there a free backtesting site?
Yes. Backtestle is free during beta; it offers replay backtesting on 189 forex, gold, index and crypto symbols with available historical data, plus a prop firm challenge simulator. On TradingView's free plan, Bar Replay works only on daily and higher timeframes.
How many years of data do I need for a forex backtest?
There is no single number; what matters is covering different market conditions (trend, range, high and low volatility) and reaching enough trades. An intraday strategy with about one setup a day gives roughly 250 trades a year; a swing strategy with one setup a week needs more than two years to reach 100 trades.
Manual or automated backtesting?
Automated backtesting is fast for rules you can code. For price action setups that need judgment, manual replay is more realistic and also trains you to spot the setup.
Can I backtest without coding?
Yes. Manual backtesting needs no code: you replay the chart candle by candle and place the order, stop and target by hand at every setup that fits your rules. Results are recorded in R and the statistics are calculated for you.
How do I avoid seeing the future in a backtest?
Use a replay with the right side hidden instead of looking back at a static chart; decide on the candle where the setup forms and do not move the stop or target after seeing the outcome. If you change a rule mid-test, start a new test.
How do I backtest a news release such as NFP?
Open a moment before the release and play the chart from there. US non-farm payrolls (NFP) are usually released on the first Friday of the month at 08:30 New York time; spreads widen and slippage happens in those minutes, so count news trades separately. The "play this moment" links in this guide open EURUSD right at an NFP release.
Where should I record my backtest results?
For each trade, keep the date, symbol, direction, result (R), setup name and a short note; a screenshot makes mistakes easier to find later. A spreadsheet is enough; on Backtestle, trades closed in replay are written to your backtest log automatically.
Try it now
Free bar replay on 189 symbols with available historical data at Backtestle; trades are logged automatically in R and $, and stats are calculated for you.
Terms in this guide
See the glossary for a short definition and a worked example.
- Lot
- R (R multiple)
- Risk-to-reward ratio (stop loss and take profit)
- Expectancy and win rate
- Pip
- Spread and commission
- Swap
- Slippage
- Backtest
- Forward test
- Replay (bar replay)
- Overfitting
- Confidence interval and sample size
More guides
- How many trades are enough in a backtest?expectancy in R, 95% confidence interval, 30-50-100-200 trades
- How to pass a prop firm challengerisk plan and rule management
- 7 steps before a prop firm challengea prep checklist before you pay for a challenge
- Consistency rule (best day %)best day calculator, worked example and firm table
- How is the daily loss limit calculated?base (starting balance / day's opening balance), reset time, floating loss; firm table
- What are swap and spread?triple swap day, TRY pairs, swap-free, news spread, weekend gaps
- Prohibited strategies at prop firmsHFT, latency arbitrage, cross-account hedging, copy trading, trade splitting; firm table
- What is a prop firm and how does it work?challenge, funded account, profit split, rules, risks; firm and program counts from code
- What is trailing drawdown?static, trailing, end-of-day trailing and locked floors; $100,000 example; program table
- Prop firms from Turkeywhich firms have a Turkey note, USD / EUR fees, payouts and identity verification
- All guidesindex and reading order
- Prop firm comparison tablerules of 33 firms
- Backtesting software compareda sourced, dated comparison with FX Replay, Forex Tester, TradingView, BacktestingMax and TradeZella
- Prop rule changelogdated, sourced rule changes and points we could not verify
- Prop firm and backtesting glossarytrailing drawdown, daily loss, R, pip, spread and more
- FAQpricing, symbols, data source and the prop simulator
Sources (last checked: October 13, 2026)
- Investopedia: What is backtesting? ↗
- Investopedia: Maximum drawdown ↗
- Investopedia: Overfitting ↗
- Investopedia: Hindsight bias ↗
- NIST: Confidence limits with the t distribution ↗
Last checked: October 13, 2026. Firms can change their rules; check the firm's current page before you buy. This content is for education and practice only, not investment advice; past results do not guarantee future returns.